
CARS with KC in TELUGU
@carswithkcintelugu
Autos & Vehicles622
Video Count62.1M
Video View197.0K
Subscriber#15,206
India Rank#113,570
Global RankLoading channel statistics
General and Autos & Vehicles ranking performance
General
Global
India
Autos & Vehicles
Global
India
Total Videos
Content Library
Total Views
Lifetime Views
Subscribers
Community Size
Engagement Rate
Audience Interaction
Top performer by views
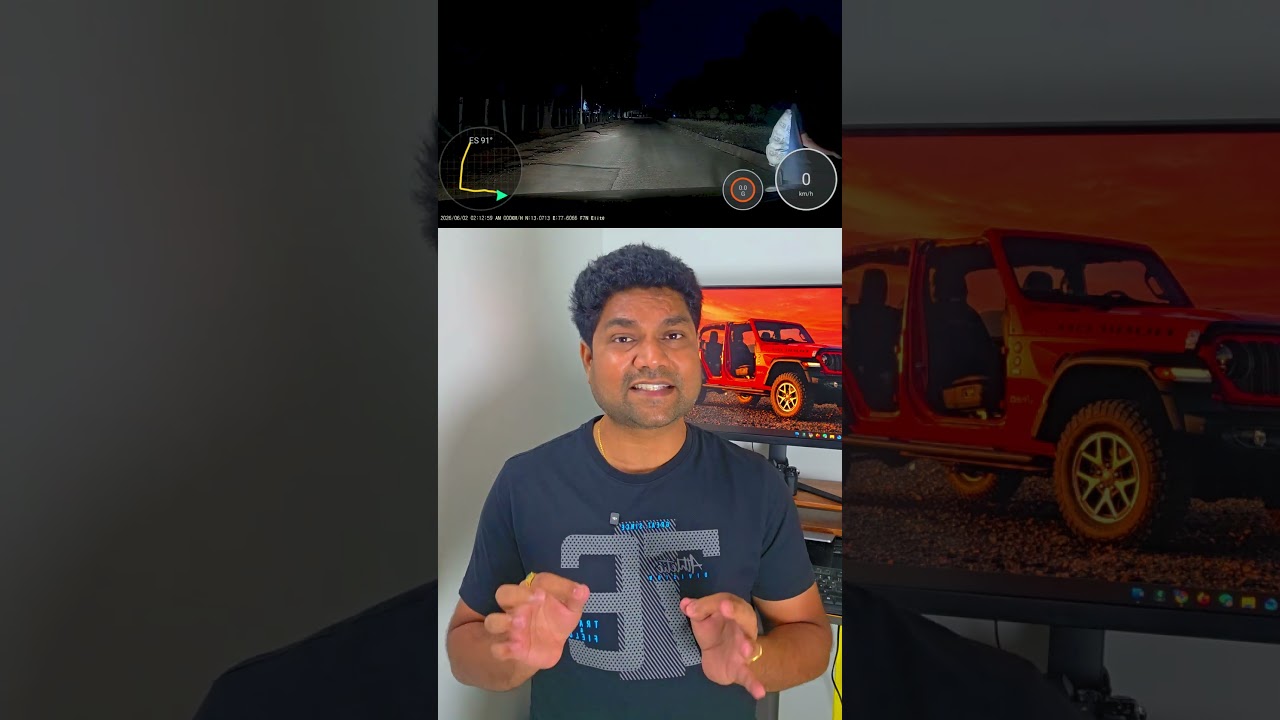
The Science Behind Car Key Range Increase! #CarKey #CarRemote #CarKeyScience #RFSignal #Automobile
1.1M
Views
21.4K
Likes
465
Comments
Opportunity for growth
CARS with KC in TELUGU is live #weekendlive #may17 #2026 #carswithkc
900
Views
93
Likes
2
Comments
Analysis of 26 long-form videos
The Science Behind Car Key Range Increase! #CarKey #CarRemote #CarKeyScience #RFSignal #Automobile
• Long videos make up 52% of total content
• Average performance: Lower than channel average
• Most common duration: Short Long (1-3 min)
Upload patterns and optimal timing insights
Content distribution across 4 main categories
Key performance indicators and trends
Vehicle dominates with 50% of content
Society has highest avg views
Entertainment shows strongest growth
Most used tags across 506 tag instances
13 tags in category
2 tags in category
Comprehensive tag metrics and ROI analysis
| Tag | Usage | Avg Views | Engagement | Growth | ROI Score |
|---|---|---|---|---|---|
| #cars with kcTop 1 | 50 | 76.4K | 1.98% | -71% | 21/100 |
| #in teluguTop 2 | 49 | 77.9K | 1.98% | -70% | 21/100 |
| #krishna chaithanyaTop 3 | 49 | 77.9K | 1.98% | -70% | 21/100 |
| #trending | 49 | 77.9K | 1.98% | -70% | 21/100 |
| #cars | 49 | 77.9K | 1.98% | -70% | 21/100 |
| #car reviews | 49 | 77.9K | 1.98% | -70% | 21/100 |
| #entertainment | 49 | 77.9K | 1.98% | -70% | 21/100 |
| #cars comparison | 49 | 77.9K | 1.98% | -70% | 21/100 |
| #automobile | 49 | 77.9K | 1.98% | -70% | 21/100 |
| #vehicles | 47 | 80.8K | 1.98% | -68% | 21/100 |
| #carswithkc | 7 | 8.2K | 2.92% | +135% | 29/100 |
| #auto news telugu | 3 | 7.4K | 2.80% | +100% | 28/100 |
| #ev cars india | 3 | 15.2K | 1.75% | -79% | 18/100 |
| #may 2026 car sales | 2 | 5.3K | 3.50% | +100% | 35/100 |
| #tata sierra | 2 | 4.4K | 4.18% | +100% | 42/100 |
Strategic recommendations and performance highlights
Top 5 by view count


Top 5 by like count
Top 5 by comment count


Top 5 by engagement rate


Peak performance metrics across all categories
Top performers across multiple categories


Performance analysis and recommendations