
Fowler's Makery and Mischief
@fowlersmakeryandmischief
Howto & Style559
Video Count282.0M
Video View1.8M
Subscriber#7,533
United States Rank#30,885
Global RankLoading channel statistics
General and Howto & Style ranking performance
General
Global
United States
Howto & Style
Global
United States
Total Videos
Content Library
Total Views
Lifetime Views
Subscribers
Community Size
Engagement Rate
Audience Interaction
Top performer by views
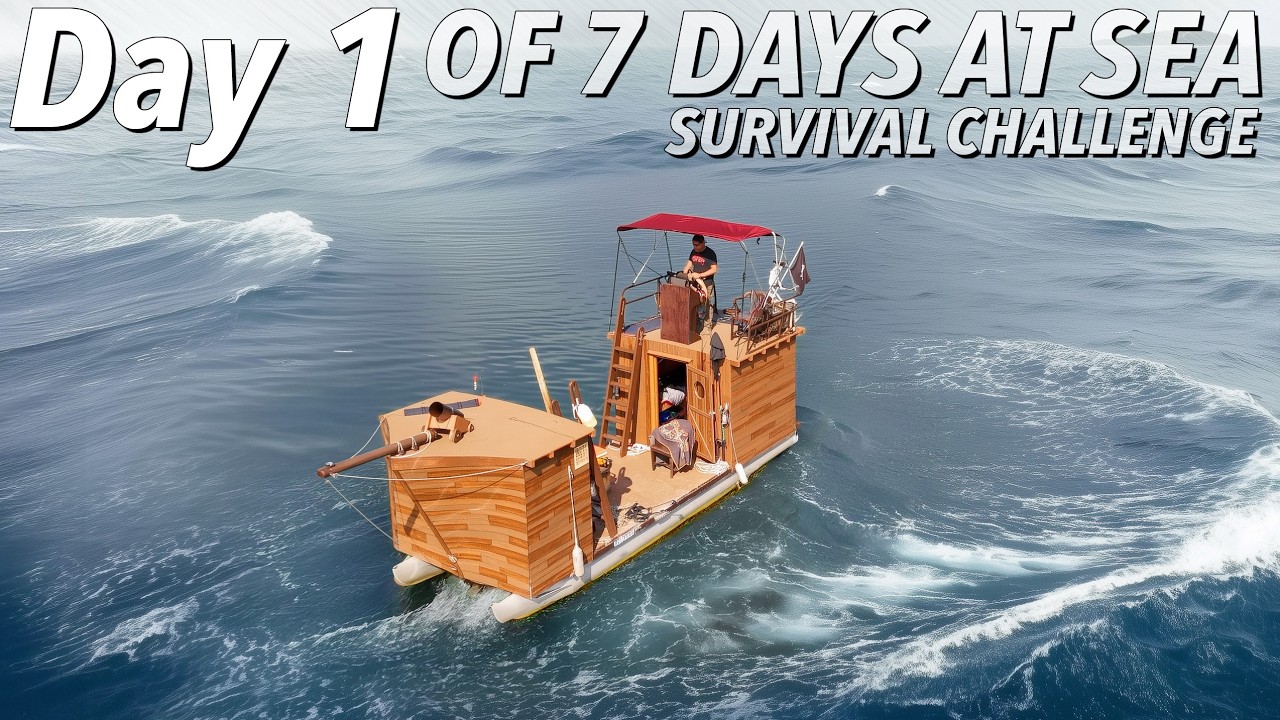
Leaving Civilization Day 1 of 7 days Waterworld Survival Challenge The Ocean Season 3
549.1K
Views
11.3K
Likes
597
Comments
Opportunity for growth
Day 2 On the Ice Season 2 The Road Trip Ep.2 New York Catch and Cook
0
Views
10
Likes
1
Comments
Analysis of 45 long-form videos
Leaving Civilization Day 1 of 7 days Waterworld Survival Challenge The Ocean Season 3
• Long videos make up 90% of total content
• Average performance: Better than channel average
• Most common duration: Very Long (30+ min)
Upload patterns and optimal timing insights
Content distribution across 6 main categories
Key performance indicators and trends
Lifestyle Sociology dominates with 37% of content
Entertainment has highest avg views
Tourism shows strongest growth
Most used tags across 414 tag instances
10 tags in category
Comprehensive tag metrics and ROI analysis
| Tag | Usage | Avg Views | Engagement | Growth | ROI Score |
|---|---|---|---|---|---|
| #catch and cookTop 1 | 48 | 106.5K | 2.86% | -86% | 30/100 |
| #fowlers makery and mischiefTop 2 | 47 | 83.6K | 2.81% | -82% | 29/100 |
| #fowlerTop 3 | 47 | 83.6K | 2.81% | -82% | 29/100 |
| #fowler survival | 46 | 77K | 3.02% | -80% | 31/100 |
| #survival | 42 | 82.8K | 3.00% | -82% | 31/100 |
| #survival challenge | 42 | 82.8K | 3.00% | -82% | 31/100 |
| #fowler survival challenge | 40 | 86.9K | 3.00% | -82% | 31/100 |
| #catch n cook | 32 | 72.2K | 2.95% | -79% | 30/100 |
| #catch clean cook | 27 | 72.9K | 2.83% | -80% | 29/100 |
| #solo survival | 8 | 153.8K | 3.17% | +0% | 33/100 |
| #waterworld survival challenge | 7 | 175.8K | 3.17% | +0% | 33/100 |
| #waterworld season 3 | 7 | 175.8K | 3.17% | +0% | 33/100 |
| #survival challenge ocean | 7 | 175.8K | 3.17% | +0% | 33/100 |
| #catch and cook challenge | 7 | 175.8K | 3.17% | +0% | 33/100 |
| #surviving off the ocean | 7 | 175.8K | 3.17% | +0% | 33/100 |
Strategic recommendations and performance highlights
Top 5 by view count


Top 5 by like count


Top 5 by comment count
Top 5 by engagement rate


Peak performance metrics across all categories
Top performers across multiple categories


Performance analysis and recommendations