
Domain of Science
@domainofscience
Education71
Video Count70.6M
Video View1.6M
Subscriber#990
United Kingdom Rank#34,528
Global RankLoading channel statistics
General and Education ranking performance
General
Global
United Kingdom
Education
Global
United Kingdom
Total Videos
Content Library
Total Views
Lifetime Views
Subscribers
Community Size
Engagement Rate
Audience Interaction
Top performer by views
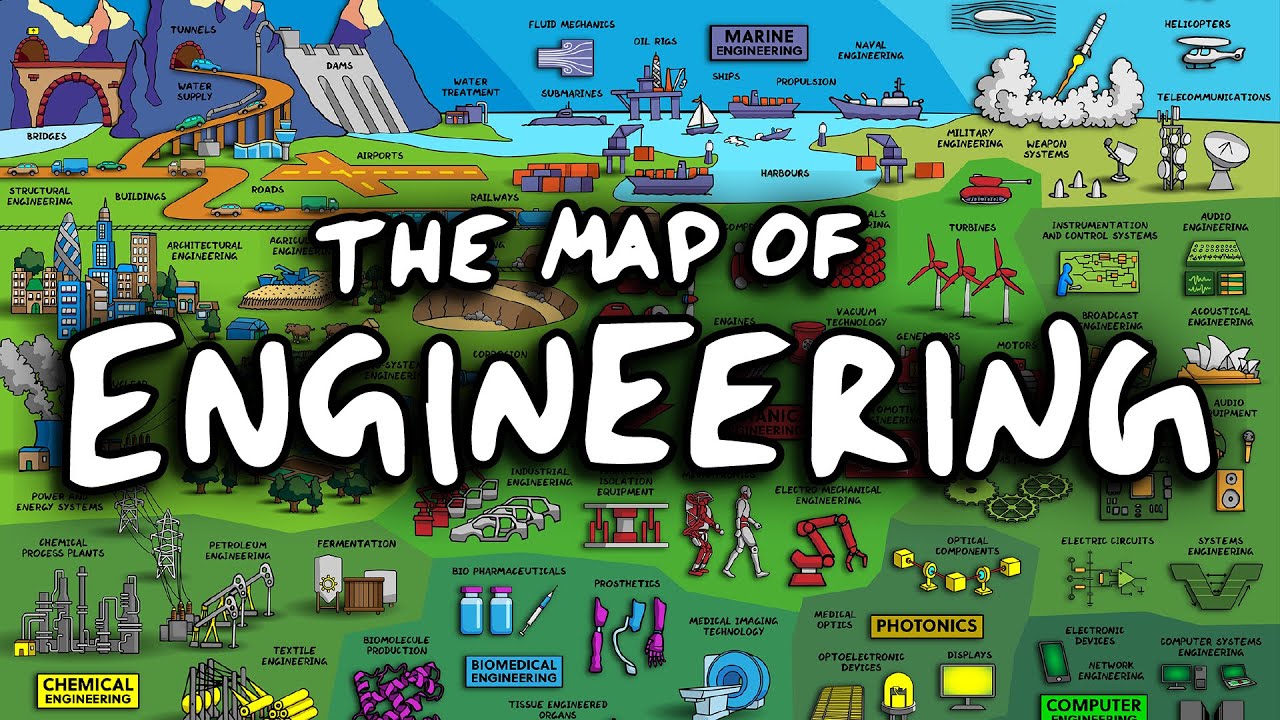
The Map of Engineering
2.6M
Views
91.1K
Likes
1.9K
Comments
Opportunity for growth
Top Science Advances of 2025 - Roundup Stream
0
Views
0
Likes
0
Comments
Analysis of 39 long-form videos
The Map of Engineering
• Long videos make up 78% of total content
• Average performance: Better than channel average
• Most common duration: Long (10-30 min)
Upload patterns and optimal timing insights
Content distribution across 8 main categories
Key performance indicators and trends
Knowledge dominates with 75% of content
Society has highest avg views
Knowledge shows strongest growth
Most used tags across 45 tag instances
15 tags in category
Comprehensive tag metrics and ROI analysis
| Tag | Usage | Avg Views | Engagement | Growth | ROI Score |
|---|---|---|---|---|---|
| #spaceTop 1 | 5 | 322.1K | 4.35% | +0% | 47/100 |
| #explainerTop 2 | 5 | 340.2K | 4.32% | +0% | 47/100 |
| #scienceTop 3 | 5 | 340.2K | 4.32% | +0% | 47/100 |
| #cosmology | 4 | 276.7K | 5.01% | +0% | 53/100 |
| #physics | 4 | 294.1K | 4.93% | +0% | 52/100 |
| #universe | 3 | 344.9K | 4.99% | +0% | 53/100 |
| #animation | 3 | 368.2K | 4.91% | +0% | 53/100 |
| #quantum physics | 2 | 742.9K | 4.21% | +0% | 50/100 |
| #quantum mechanics | 2 | 742.9K | 4.21% | +0% | 50/100 |
| #black holes | 2 | 193.9K | 4.58% | +0% | 48/100 |
| #big bang | 2 | 352K | 4.65% | +0% | 50/100 |
| #infographic | 2 | 390.9K | 4.97% | +0% | 54/100 |
| #observable universe | 2 | 207.9K | 4.81% | +0% | 50/100 |
| #astrophysics | 2 | 503.7K | 5.01% | +0% | 55/100 |
| #black hole | 2 | 358.1K | 4.95% | +0% | 53/100 |
Strategic recommendations and performance highlights
Top 5 by view count


Top 5 by like count

Top 5 by comment count


Top 5 by engagement rate


Peak performance metrics across all categories
Top performers across multiple categories


Performance analysis and recommendations