
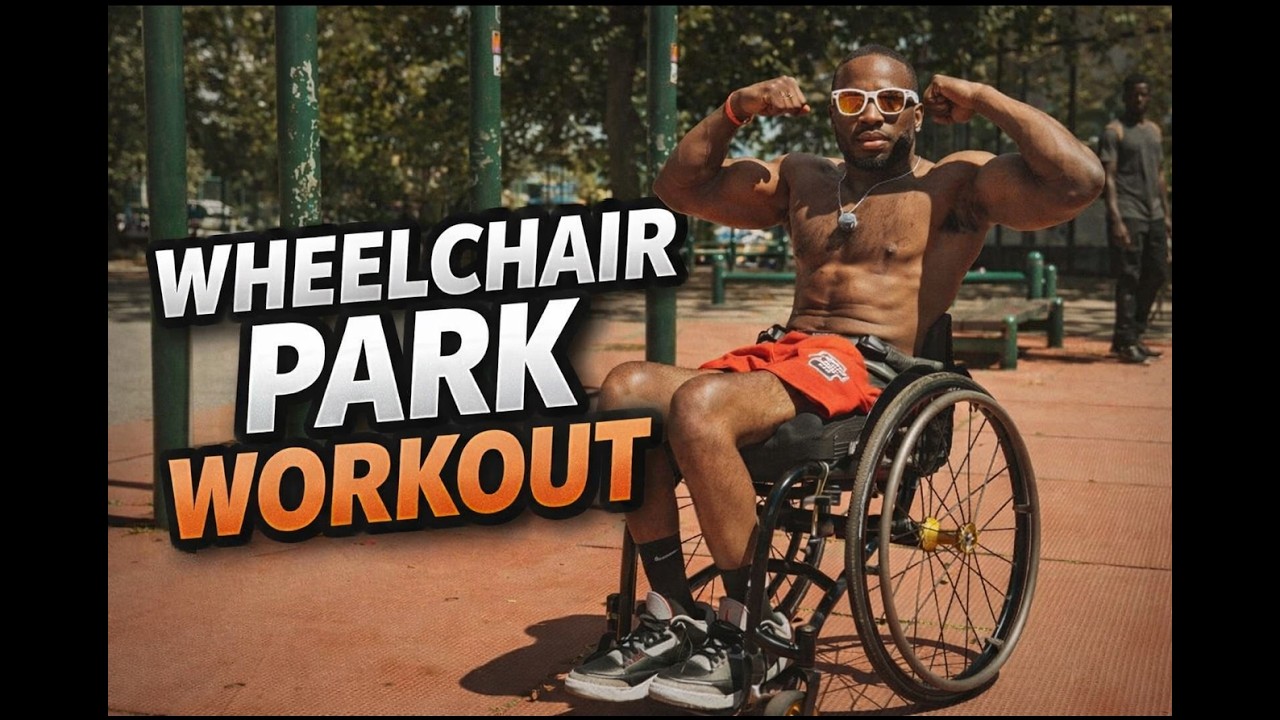
Garrison Redd
@garrisonredd
Health & Fitness504
Video Count36.5M
Video View37.8K
Subscriber#33,047
United States Rank#180,150
Global RankLoading channel statistics
General and Health & Fitness ranking performance
General
Global
United States
Health & Fitness
Global
United States
Total Videos
Content Library
Total Views
Lifetime Views
Subscribers
Community Size
Engagement Rate
Audience Interaction
Top performer by views
2 wheelchairs. 1 car. ♿️🚗 did you think this was possible? Be honest #driving #tutorial #nyc
17.9K
Views
777
Likes
41
Comments
Opportunity for growth
When you trust God, fear loses its power.🙌🙏♿️ #motivation #paralyzed #calisthenics #pullups #nyc
34
Views
8
Likes
2
Comments
Analysis of 15 long-form videos
Traveling paralyzed ♿️ listen to how I do it 👏👏👏 #paralyzed #motivation #travel #flight #airline
• Long videos make up 30% of total content
• Average performance: Better than channel average
• Most common duration: Short Long (1-3 min)
Upload patterns and optimal timing insights
Content distribution across 7 main categories
Key performance indicators and trends
Lifestyle Sociology dominates with 43% of content
Lifestyle Sociology has highest avg views
Video Game Culture shows strongest growth
Top 5 by view count


Top 5 by like count


Top 5 by comment count

Top 5 by engagement rate


Peak performance metrics across all categories
Top performers across multiple categories


Performance analysis and recommendations